y=x;
f=outer(x,y,function(x,y)cos(y)/(1+x^2));
f[1:5, 1:5]
# The contour() function produces a contour map and is used for three
# dimensional data (like mountains). You feed it three inputs. The first
# is a vector of the x values, the second a vector of the y values and
# the third is a matrix with each element corresponding to the Z value
# (the third dimension) for each pair of (x,y) coordinates. Just like
# plot there are many other things you can feed it to. See the help file.
contour(x,y,f)
contour(x,y,f,nlevels=15)
# persp() works the same as image() and contour() but it actually
# produces a 3d plot. theta an phi control the various angles you can look
# at the plot from.
persp(x,y,f)
persp(x,y,f,theta=30)
persp(x,y,f,theta=30,phi=20)

########################################################################
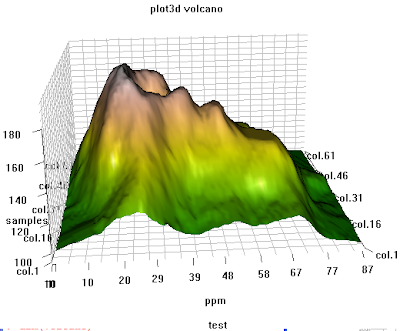
## another example of 3d plot from my personal reserach, use rgl library
########################################################################
# 3D visualization device system
library(rgl);
data(volcano)
dim(volcano)
peak.height <- volcano;
ppm.index <- (1:nrow(volcano));
sample.index <- (1:ncol(volcano));
zlim <- range(peak.height)
zlen <- zlim[2] - zlim[1] + 1
colorlut <- terrain.colors(zlen) # height color lookup table
col <- colorlut[(peak.height-zlim[1]+1)] # assign colors to heights for each point
open3d()
ppm.index1 <- ppm.index*zlim[2]/max(ppm.index);
sample.index1 <- sample.index*zlim[2]/max(sample.index)
title.name <- paste("plot3d ", "volcano", sep = "");
surface3d(ppm.index1, sample.index1, peak.height, color=col, back="lines", main = title.name);
grid3d(c("x", "y+", "z"), n =20)
sample.name <- paste("col.", 1:ncol(volcano), sep="");
sample.label <- as.integer(seq(1, length(sample.name), length = 5));
axis3d('y+',at = sample.index1[sample.label], sample.name[sample.label], cex = 0.3);
axis3d('y',at = sample.index1[sample.label], sample.name[sample.label], cex = 0.3)
axis3d('z',pos=c(0, 0, NA))
ppm.label <- as.integer(seq(1, length(ppm.index), length = 10));
axes3d('x', at=c(ppm.index1[ppm.label], 0, 0), abs(round(ppm.index[ppm.label], 2)), cex = 0.3);
title3d(main = title.name, sub = "test", xlab = "ppm", ylab = "samples", zlab = "peak")
rgl.bringtotop();


No comments:
Post a Comment